 Private Portfolio
Third Street 3.0
This portfolio is shared by invitation.
Enter the access code you were given.
Access codes are refreshed periodically. Request the current one →
Private Portfolio
This portfolio is shared by invitation.
Enter the access code you were given.
Access codes are refreshed periodically. Request the current one →


The area today, and the impact we'd build.
The location
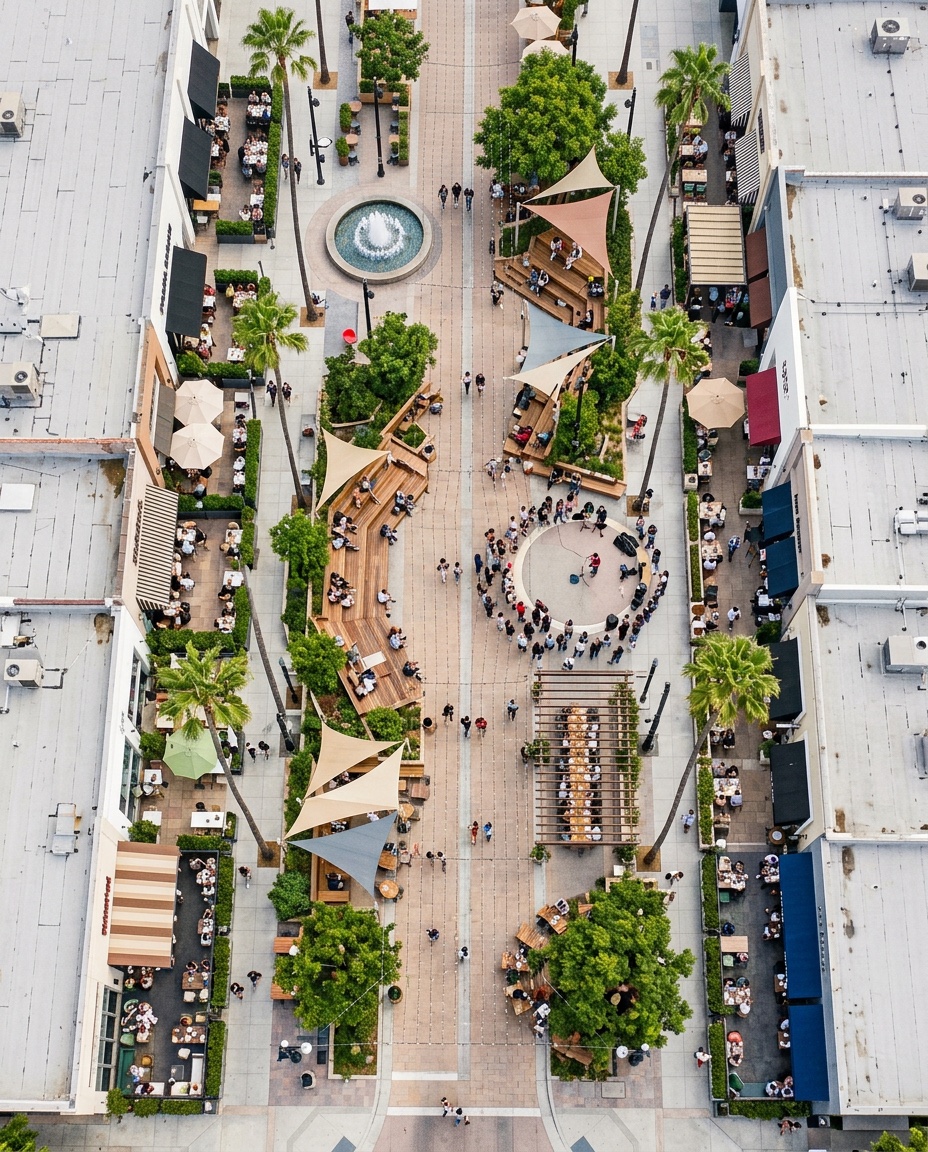
Most of Los Angeles drives. The Westside walks - and it walks here. Third Street Promenade sits at the centre of one of the densest, most affluent pedestrian catchments in Southern California. The fundamentals are already in place: the people, the spending power, the foot traffic. The gap is what happens after the shops close - and that's exactly the gap we're built to fill.
The catchment
Sourced to ACS, ESRI and Caltrans data, by ring, centred on the North End of the Promenade - prime working-age, high-income, walk-first.
Spending power
Movement
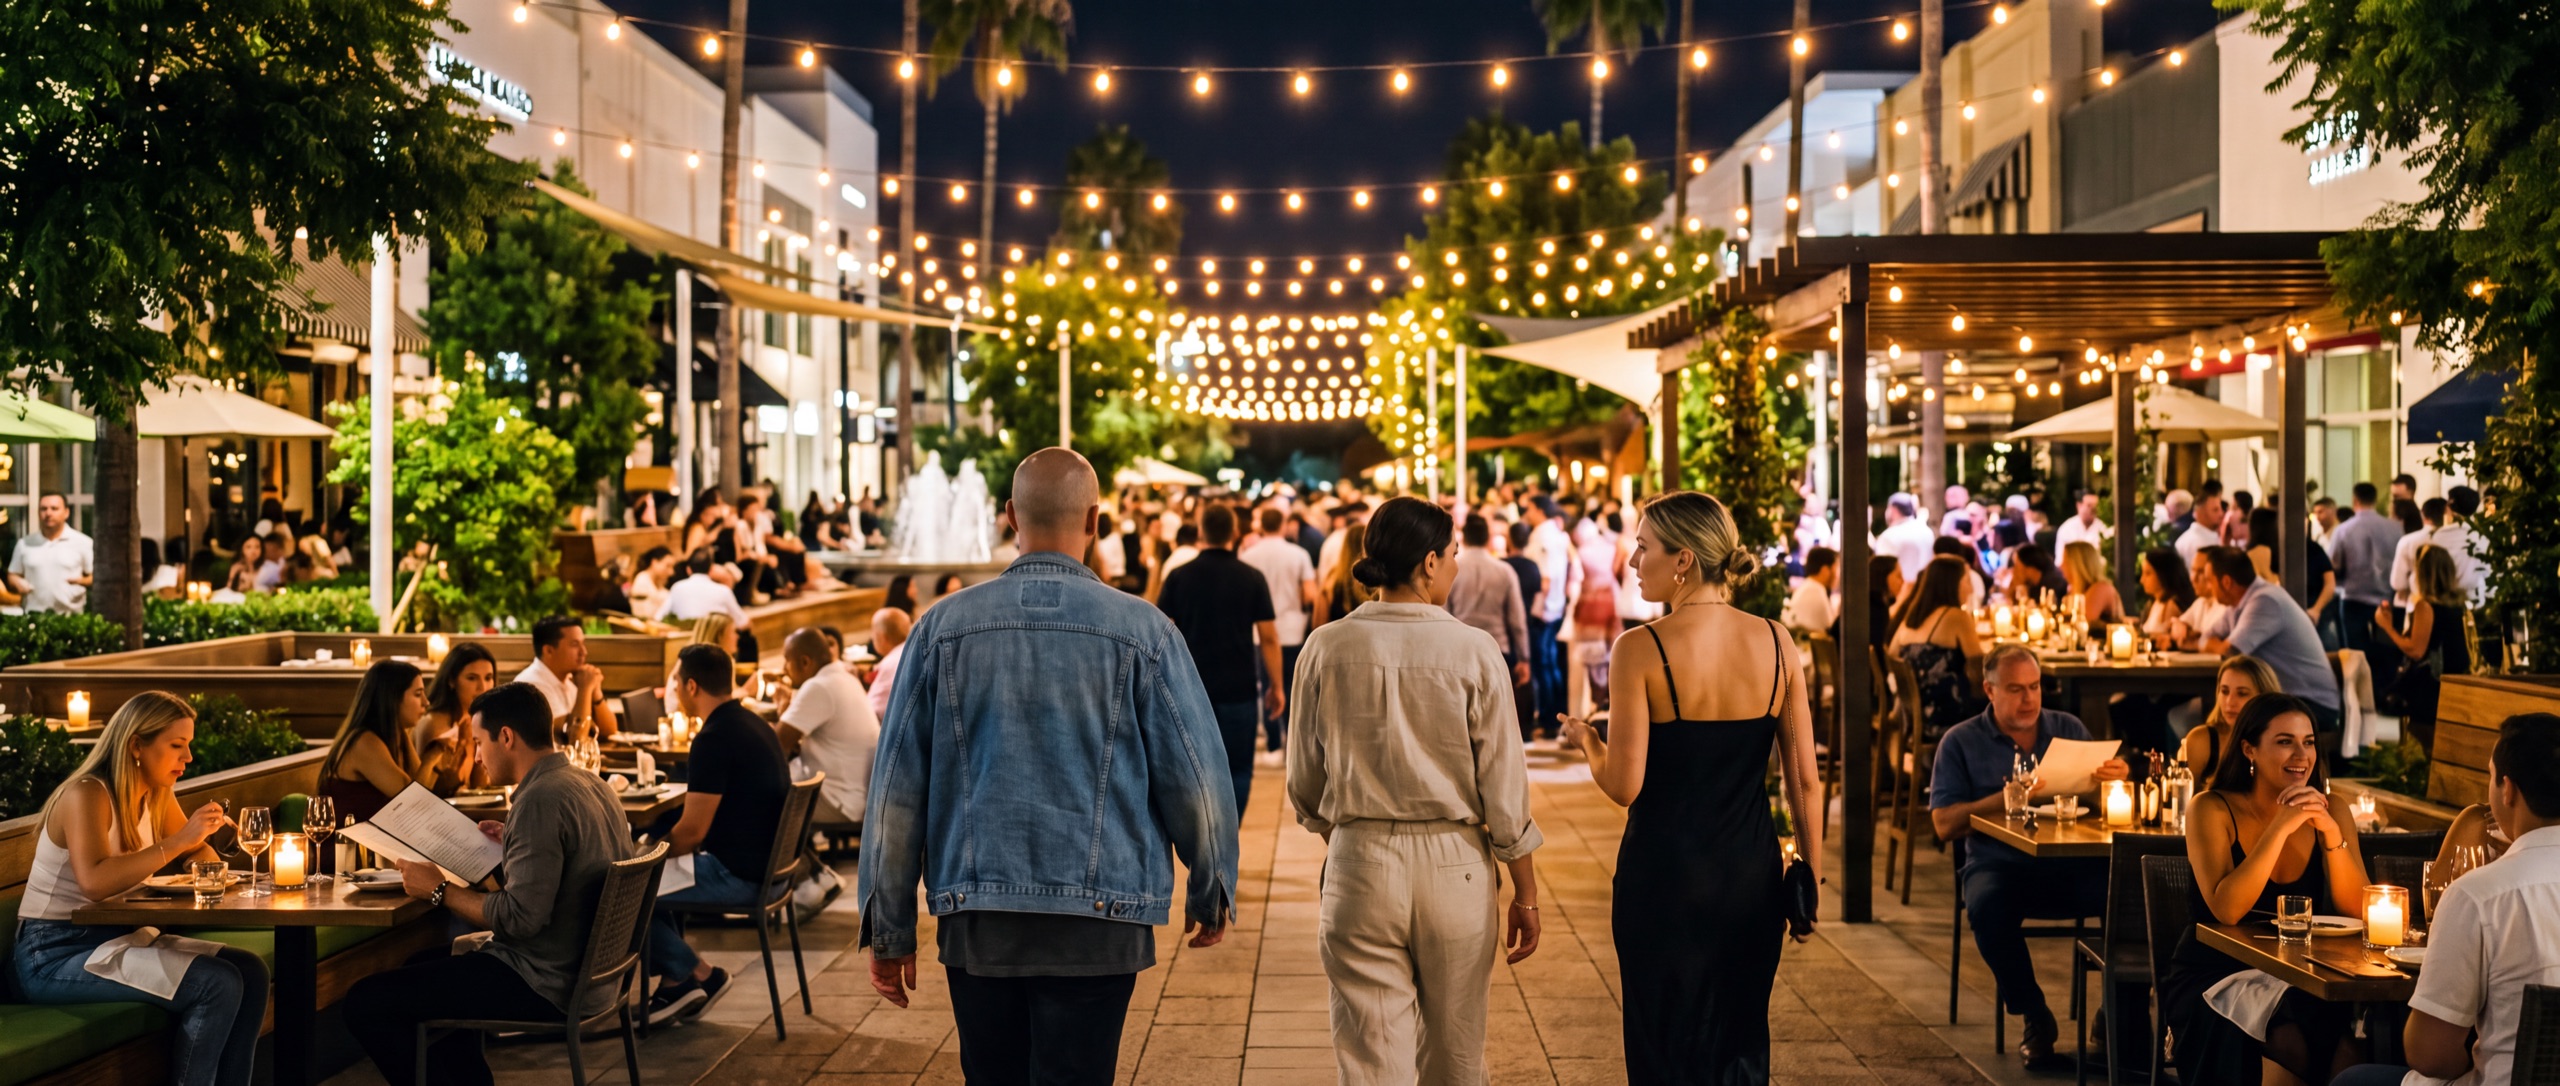
Tens of thousands pass through every day - on foot, by bike, and by car. The challenge was never getting people to the Promenade. It's giving them a reason to stay once they're here.
The challenge was never getting people here. It's giving them somewhere to be.
The neighbourhood
Minutes from some of the wealthiest communities in America - the everyday catchment that dines, drinks, and spends here.
Several of these zip codes rank among the highest median home values and household incomes in the United States.
This is why we're building a district, not a venue. The location does half the work. We do the rest - the concepts, the operators, the standards, the momentum.
The impact
The trade area is the setup. This is the payoff - what the district gives back once it is built out, with the concepts running and the empty units filled.
Nothing here is a fixed claim. It is a model. Set how many venues are open and what people spend, and every number moves with you.
Footfall & spend
The weekly rhythm
Saturday is the peak. Drag any other day to set how busy it runs.
A regional destination - on visitor itineraries and hotel-concierge lists.
2028 Olympic year
-
-
Anticipated revenue
A year of visitor spend at 15 venues: $41M
Critical mass is about ten quality venues - concepts worth travelling for, not just ten doors. Reach benchmarked against Santa Monica's 8M+ annual visitors; every figure is a planning estimate, not a promise.
Property value
Hospitality density is one of the fastest-acting levers for repricing real estate. Cross the ~10-venue critical-mass threshold and the land around the district reprices - hard. These figures track the venue count above.
Santa Monica sits on unusually favourable fundamentals - chain-retail rules lifted, an outdoor Entertainment Zone, a multi-million-dollar city package, and major events through 2028 - which supports the top of these ranges. Read the property-value research →
Jobs
Real employment, honestly counted. Front-line hospitality stays fully human - it is the experience. The back office runs on software, so we carry a fraction of a traditional operator's central overhead. These scale with the venue count above.
Front-line
Bartenders, barbacks, servers, runners, bussers and hosts - plus kitchen brigades, baristas, floor managers, sommeliers, lane and wellness staff. Roughly 23 people a venue, unchanged from a traditional operator.
The centre
Scheduling, payroll, inventory, purchasing and central marketing run on software, not a back office - cutting corporate headcount 70-80% versus a traditional multi-unit operator. A small shared team, not a layer at every venue.
Creative roster
Musicians, DJs, bands, performers and artists - engaged per gig, not carried on payroll. Thousands of paid gig-nights a year across the district, real recurring work for the local creative economy.
Services and supply
Security, cleaning, maintenance and valet - plus produce, beverage, coffee, laundry, florists and delivery. Every venue feeds other local businesses, counted conservatively from wages, not revenue.
Every figure above is a planning range, built bottom-up from real covers and Santa Monica's own tax rates - not headline math. Refine the inputs and it all re-locks.
Keep exploring
The evidence
Independent, sourced and public. Open any of it: